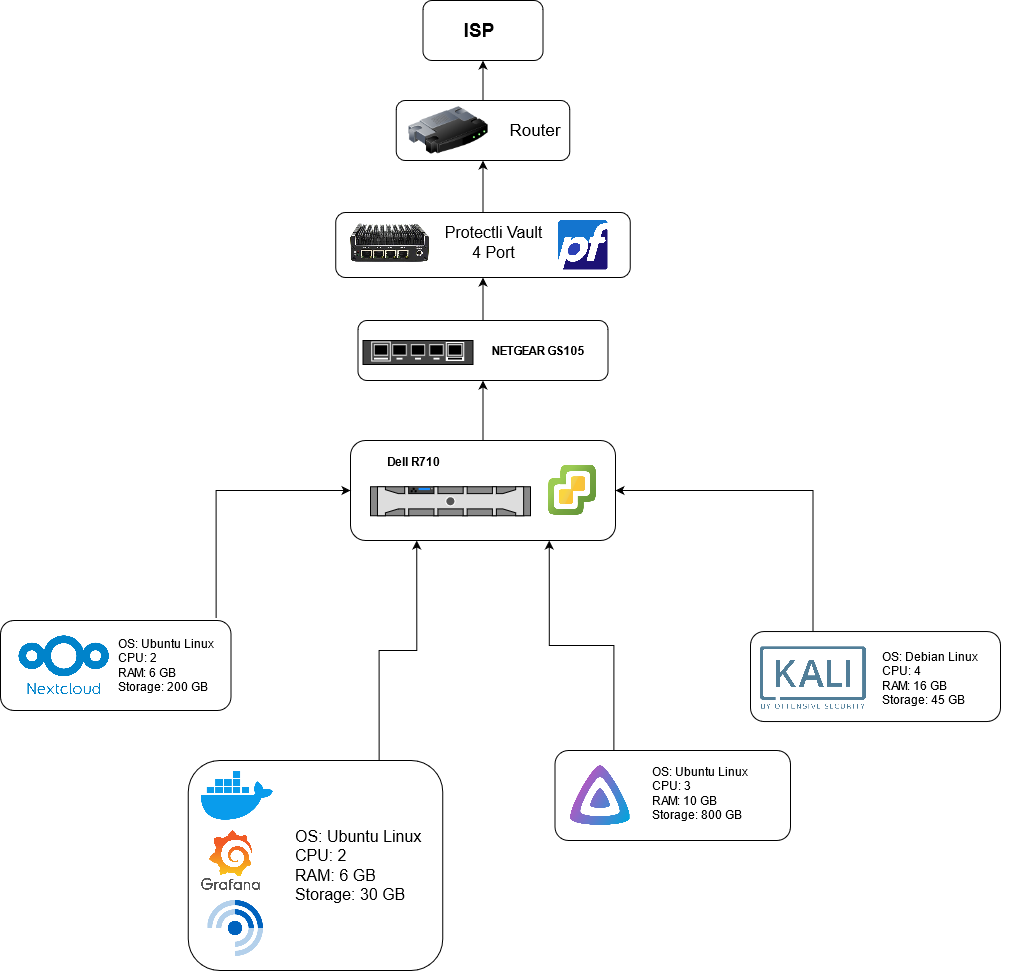
Homelab
Introduction
I wanted to build a Homelab for myself in order to get enterprise experience without having an enterprise-caliber occupation. I then started doing research and asking around until I found a setup that worked for me. This write-up is my journey through creating my Homelab.
Materials
Hardware
| Type | Name | Cost (USD $) |
|---|---|---|
| Firewall | Protectli Vault 4 Port | 319.00 |
| Power strip with surge protector | Tripp Lite 650VA UPS Battery Backup, LCD, 325W Eco Green, USB, RJ11, 8 Outlets | 95.08 |
| Server | Dell PowerEdge R710 2U Server X5650 2.66GHz 12-Cores / 64gb / 3x 1TB SAS / 2xPSU | 326.76 |
| Cat 8 Ethernet Cable | Cat8 Ethernet Cable, Outdoor\&Indoor, 6FT Heavy Duty High Speed 26AWG Cat8 LAN Network Cable 40Gbps, 2000Mhz with Gold Plated RJ45 Connector, Weatherproof S/FTP UV Resistant for Router/Gaming | 8.99 |
| Cat 7 Ethernet Cable | Cat7 Ethernet Cable 1.5 ft (2 Pack) RJ45 Connector - Double Shielded STP - 10 Gigabit 600MHz | 7.49 |
| Cat 7 Ethernet Cable | Amazon Basics RJ45 Cat 7 High-Speed Gigabit Ethernet Patch Internet Cable, 10Gbps, 600MHz - White, 5-Foot | 6.99 |
| Unmanaged Switch | NETGEAR 5-Port Gigabit Ethernet Unmanaged Switch (GS105NA) | 28.99 |
| Power Cord | Cable Matters 2-Pack 16 AWG Heavy Duty 3 Prong Computer Monitor Power Cord in 15 Feet, UL Listed (NEMA 5-15P to IEC C13) | 24.99 |
| Total | 818.29 |
Software/OS
| Type | Name |
|---|---|
| Firewall | pfSense |
| Virtualization (Type I Hypervisor) | VMware ESXi 6.5U3 |
| Cloud | NextCloud |
| RSS Feed | FreshRSS |
| Password/Hash Cracking | Kali Linux |
| Media System | Jellyfin |
| Dashboard | Homer |
Firewall Setup
| Hardware | Software |
|---|---|
| Protectli Vault 4 Port | pfSense |
I setup the firewall first, since all of the data was going to go through the Firewall. I used Michael Bazzell's Book in order to setup pfSense on my Protectli Vault. The steps (for me) were as follows:
- Installation
- www.pfsense.org/download
- Architecture: AMD64 | Installer: USB Memstick Installer | Console: VGA | Mirror: New York
- Download the .gz file and decompress it
- You can use 7-zip for this
- You should end up with a "pfSense......-amd64.img" file
- Download Rufus or Etcher (flashing programs)
- Flash the pfSense file onto a USB device
- Power down Vault, if not powered down already
- Connect a USB keyboard and monitor to the Vault
- Insert USB into another USB port
- Power on the device
- Press Enter on all of the defaults
- After the installation is complete, disconnect the USB keyboard and Monitor
- Go to 192.168.1.1 -> user:admin / password:pfsense
- Click Advanced to allow the page to load
- Accept all defaults by clicking "Next", "Close", and "Finish"
- Activate Ports
- Activate Ports (only applicable for 4-port & 6-port)
- Access the pfSense Web interface
- "Interfaces" -> "Assignments"
- Click "Add" option next to each empty port
- Repeat until all ports have been added
- Save Changes
- Click through each new port ("Interfaces" > "Opt1"/"Opt2")
- Enable each port by checking the first box
- Save change
- Do this for all ports
- "Interfaces" -> "Assignments" to continue for the next port
- When finished with all of them, apply changes in the upper right
- "Interfaces" -> "Assignments" -> "Bridges"
- Click on "Add" to create a new bridge
- Select the LAN option and the other ports that was added with a CNTRL-CLICK or CMD-CLICK
- Provide a description, such as "bridge", and then hit "Save"
- "Firewall" -> "Rules"
- Click each port (Opt, Opt2, etc.) and click the "Add" button (up arrow) for each
- Change "Protocol" to "Any"
- Click "Save" after each port is modified
- Apply changes in the upper right after all the ports have been added
- "Interfaces" -> "Assignments"
- Click on "Add" next to "BRIDGE0" and click "Save"
- Click on a bridge, maybe called "Opt3" or "Opt5"
- Enable the Interface and change the description to "bridge"
- Click "Save", then "Apply Changes"
- "Firewall" -> "Rules"
- Click on "Bridge", then the "Add" button (up arrow)
- Change the "Protocol" to "Any" and click "Save"
- Apply changes in the upper-right
- Prevent DNS leakage
- "System" -> "General Setup"
- Add "1.1.1.1" as a DNS server, and choose the "WAN_DHCP-wan" interface
- Click "Add DNS Server"
- Add "1.0.0.1" as a DNS server and choose the "WAN_DHCP-wan" interface
- Disable "DNS server override"
- Click "Save"
- Enable AES-NI CPU Crypto & PowerD
- "System" -> "Advanced"
- Click on the "Miscellaneous" tab
- Locate the "Cryptographic & Thermal Hardware"
- Select "AES-NI CPU-based Acceleration" in the drop-down
- "System" -> "Advanced" -> "Miscellaneous" -> "Power Savings" -> Enable "PowerD"
- Disable Notifications
- "System" -> "Advanced" -> "Notifications"
- Under the "E-mail" section, disable "SMTP Notifications"
- In the "Sounds" section, check the "Disable startup/shutdown beep"
- Click "Save"
To test your DNS setup, you can use DNSleaktest.
Privacy
I believe that privacy is an important aspect of our lives. With that being said, here are some changes I added to my pfSense to make my firewall more private. I found a list of Windows telemetry domains on Github. I then added those to my pfSense using this guide. Using the same guide, I was able to choose more blocklists from pfSense's recommended list under (Firewall -> pfblockerNG -> Feeds). I also chose to add Apple's Telemetry blocking list to the blacklist as well using "TLD Blacklisting".
Server Setup
| Hardware | Software |
|---|---|
| Dell PowerEdge R710 2U Server X5650 2.66GHz 12-Cores / 64gb / 3x 1TB SAS / 2xPSU | VMware ESXi 6.5U3 | FreshRSS |
| NextCloud | |
| Kali Linux | |
| Jellyfin | |
| Homer |
My server came cleaned or "Factory Reset" so my steps are going to be after that is completed.
Network Setup
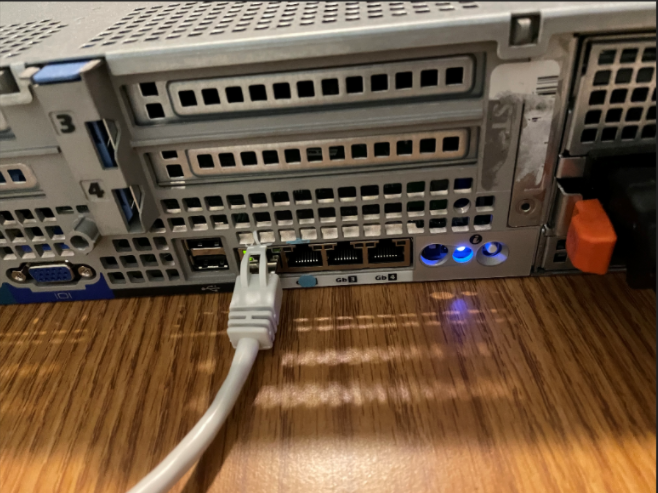
This part was straight forward on my end. I connected a Ethernet cable from the server to my switch (which was connected to my router) .
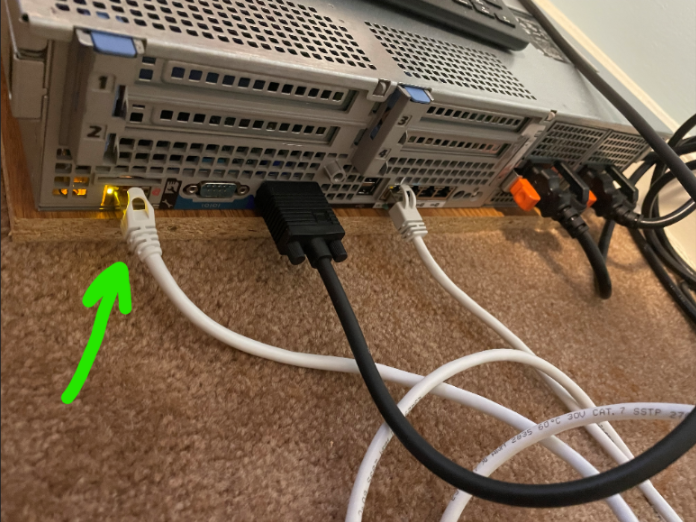
The ethernet cable on the left (white cable) is for the network of the server.
I connected a monitor and USB Keyboard to my server so I can see what is going on. My server is a bit older so it booted up for 3-4 minutes, and then it showed an IP Address for the server. You should be able to connect to that IP Address through your browser (as long as you are on the same network). I have IDRAC (Integrated Dell Remote Access Controller 6), so that is what I am accessing on the web. After the login screen (user: root / password: calvin), I then went on the login screen:

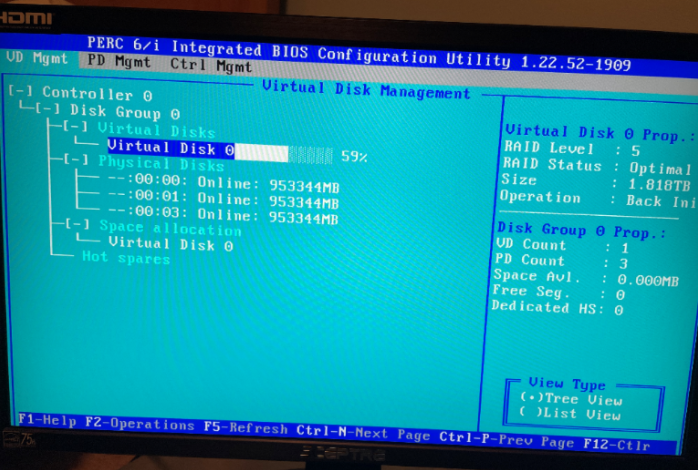
RAID-5 Setup
I wanted to have a backup system for my server. I used RAID (Redundant Array of Inexpensive Disks) in order to have a backup, more importantly RAID-5. RAID-5 is meant to work with 3 disks, and since I had 3 1TB hard drives, this was the best RAID model for me. After my server booted up (and after the option of configuration showed up), I tapped **CNTRL+R** in order to run the Configuration Utility. I then followed this Youtube video in order to setup RAID-5 on my server. I set it up on a screen resembling this:
VMware ESXi Setup
I downloaded ESXi from VMware. For my server, the version that worked was 6.5U3 (Version 6.5 Update 3). I used this link to find out how to find the download and how to find the license for my product. Since mine was a Dell Server, I first went to the VMware to to find the right file:
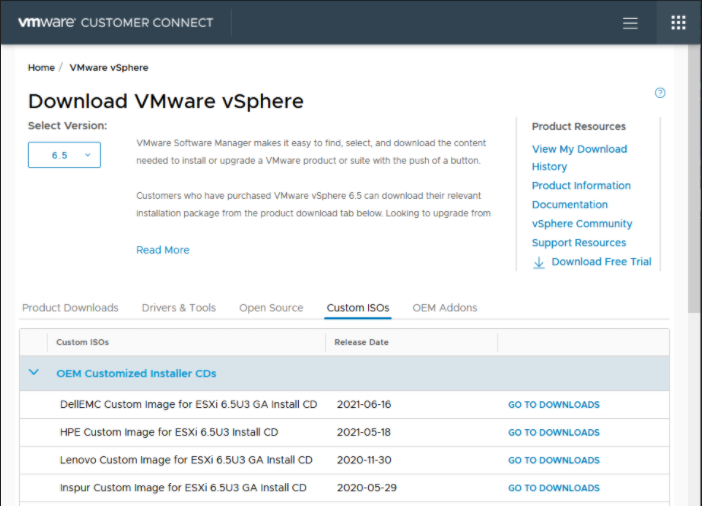
I then downloaded and then used Balena Ether in order to flash the ISO onto my USB drive. I then plugged my USB into my server and booted from the USB.
If you do not use RAID, you will still need to "virtualize" your disks that way ESXi can use it as storage.
I do not have screenshots for this part, but I can try to type out what steps I took:
- Plugged in my USB 2.0 with the Dell ESXi ISO flashed on it
- Connected my second ethernet cable to one of the 4 ethernet ports in the back :
- Powered on the server
- Waited until I was able to press "F11"
- Booted off of the USB
- When asked for where to setup ESXi, I chose my RAID-5 virtual disk
- I then waited for the packages in ESXi to download, and I ended up on a page (half yellow / half black)
- This shows the IP the ESXi is on your network
- I then was able to connect to the ESXi host, and start making VMs
My Setup
At this point, the server was built. Now I just had to modify it to my liking. I will go into detail about what I did so it is clear if someone in the future wanted to replicate it.
ESXi VMs

| VM | OS | CPU | RAM | Storage |
|---|---|---|---|---|
| NextCloud | Ubuntu Linux | 2 | 6 GB | 200 GB |
| Dashboard | Ubuntu Linux | 2 | 6 GB | 30 GB |
| Jellyfin Media Vault | Ubuntu Linux | 3 | 10 GB | 800 GB |
| Kali Linux | Debian Linux | 4 | 16 GB | 45 GB |
Nextcloud: My locally hosted cloud, so I do not have to rely on third-party software or SaaS providers.
Dashboard: This is an Ubuntu VM with 2 docker containers and Grafana:

Homer is a self-hosted dashboard for all of your server applications:
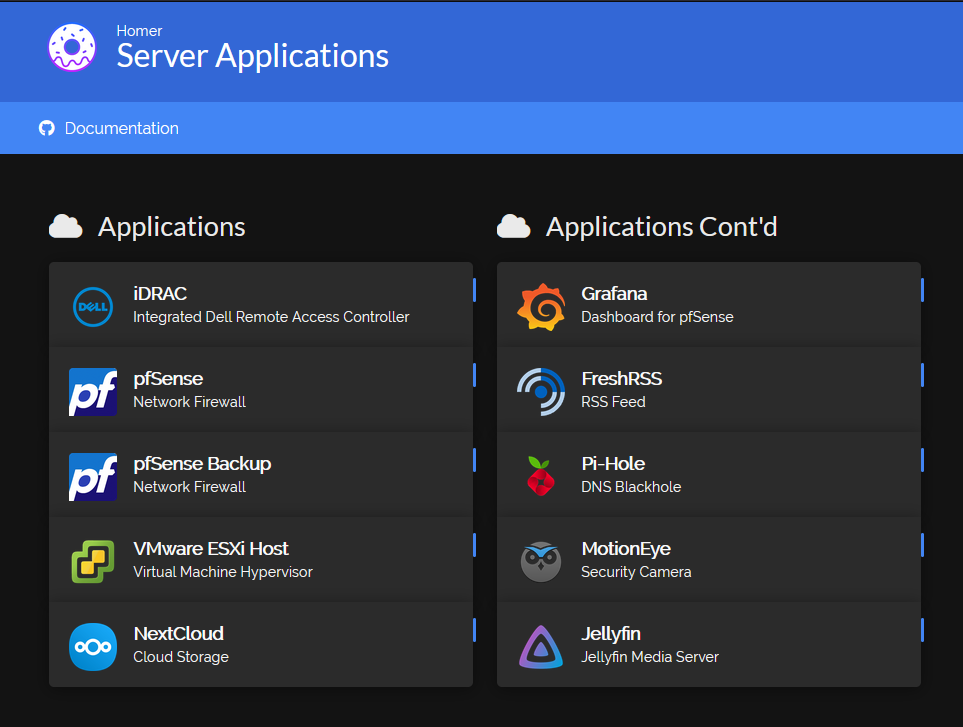
FreshRSS is an open-source RSS Feed.

Jellyfin is an open-source alternative to Plex. I use this for video game clips and more.
Kali Linux is a Linux distribution meant for penetration testing. My plan is to use this for hash cracking and WPA handshake cracking.
Grafana is a dashboard for information usually in some sort of infographic:

I use Grafana for looking at pfSense data. I followed Grafana dashboard for pfSense by PSYCHOGUN to set mine up. I just had to change some settings on my end, since they did not work for me, but I got it setup. I did not setup TLS on mine, but it would be a good idea to do so.
Grafana Dashboard Setup
Here are the steps I took to setup the Grafana Dashboard:
- Added the InfluxDB repository using the commands from the InfluxData website:
wget -qO- https://repos.influxdata.com/influxdb.key | gpg --dearmor > /etc/apt/trusted.gpg.d/influxdb.gpg
export DISTRIB_ID=$(lsb_release -si); export DISTRIB_CODENAME=$(lsb_release -sc)
echo "deb [signed-by=/etc/apt/trusted.gpg.d/influxdb.gpg] https://repos.influxdata.com/${DISTRIB_ID,,} ${DISTRIB_CODENAME} stable" > /etc/apt/sources.list.d/influxdb.list
- I then installed InfluxDB using the commands from the same website:
sudo apt-get update && sudo apt-get install influxdb
sudo service influxdb start
OR
#If the first one works, then you do not need this.
sudo apt-get update && sudo apt-get install influxdb
sudo systemctl unmask influxdb.service
sudo systemctl start influxdb
- I then ran the following commands to test that my InfluxDB setup is running:
sudo systemctl start influxdb
sudo systemctl status influxdb
sudo systemctl enable influxdb.service
- I then typed in influx on the terminal, and got a small prompt with the IP address of the influx database. Here I entered the following:
# Take out the > when copying the commands
> CREATE DATABASE "pf_firewall";
> CREATE USER "pf_firewall_write" WITH PASSWORD 'WRITE_PASSWORD'; #Password for write
> CREATE USER "pf_firewall_read" WITH PASSWORD 'READ_PASSWORD'; #Password for read
> GRANT READ ON pf_firewall TO pf_firewall_read
> GRANT WRITE ON pf_firewall TO pf_firewall_write
> exit
- I then created a retention policy for the logs
#Take out the > when copying the commands
> CREATE RETENTION POLICY 4weeks ON pf_firewall DURATION 4w REPLICATION 1
> show retention policies on pf_firewall
Output should look like the following
-------------------------------------
name duration shardGroupDuration replicaN default
---- -------- ------------------ -------- -------
autogen 0s 168h0m0s 1 true
4weeks 672h0m0s 24h0m0s 1 false
Installed Telegraf on Pfsense (System -> Package Manager -> Available Packages -> Search for Telegraf)
- Enable SSH on your pfSense
- System -> Advanced -> go to Secure Shell under Advanced and check Secure Shell Server
- Login to pfSense with SSH
- You can use cmd for this or PuTTY****
- Change directory to /bin
cd /usr/local/bin
- Use the fetch command to download files from this github and then modified the permissions
fetch https://raw.githubusercontent.com/VictorRobellini/pfSense-Dashboard/master/plugins/telegraf_pfifgw.php
fetch https://raw.githubusercontent.com/VictorRobellini/pfSense-Dashboard/master/plugins/telegraf_temperature.sh
fetch https://raw.githubusercontent.com/VictorRobellini/pfSense-Dashboard/master/plugins/telegraf_unbound.sh
fetch https://raw.githubusercontent.com/VictorRobellini/pfSense-Dashboard/master/plugins/telegraf_unbound_lite.sh
chmod 500 telegraf_*
Configuring Telegraf in Pfsense (you will have to change the IP to the IP of your DB):
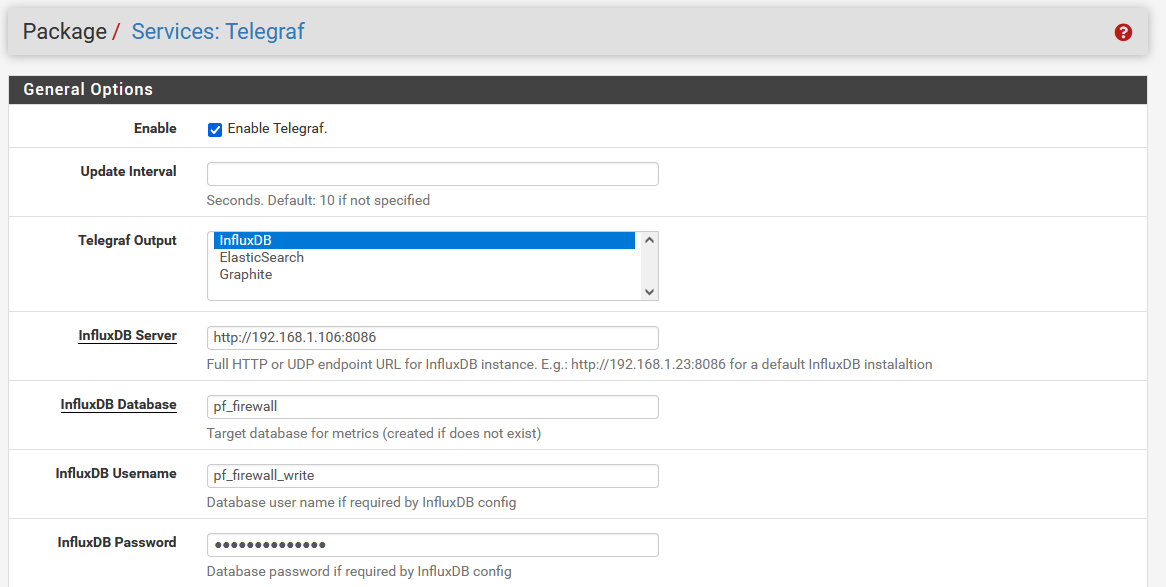
The password for the InfluxDB should be WRITE_PASSWORD.
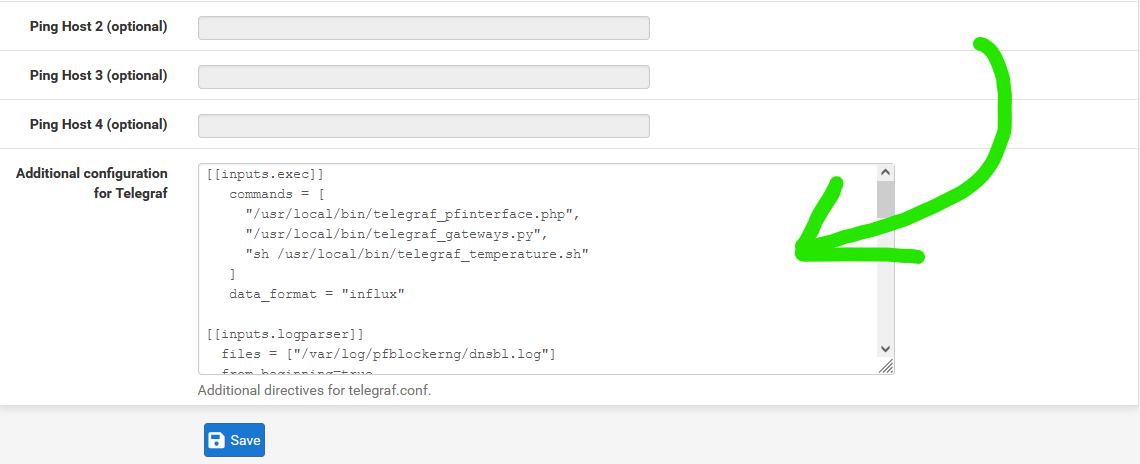
- I then pasted the following into the compartment for Additional configuration for Telegraf:
{% file src="/img/Telegraf-config.txt" %} Telegraf configuration file {% endfile %}
Installing Grafana on Ubuntu
- Ran the following commands to download Grafana onto my VM:
#Get the latest OSS release
sudo apt-get install -y apt-transport-https
sudo apt-get install -y software-properties-common wget
wget -q -O - https://packages.grafana.com/gpg.key | sudo apt-key add -

# Add stable releases to the sources
echo "deb https://packages.grafana.com/oss/deb stable main" | sudo tee -a /etc/apt/sources.list.d/grafana.list

# Update and Install
sudo apt-get update
sudo apt-get install grafana
- (Optional) Install other Panels
# Grafana worldmap panel
sudo grafana-cli plugins install grafana-worldmap-panel

# Grafana piechart panel
sudo grafana-cli plugins install grafana-piechart-panel
Adding Data source in Grafana
- Configuration > Data Sources
- Add data source
- Select: InfluxDB
- Name: pf_firewall
- URL: http://\<IP_address of InfluxDB>:8086
- Database: pf_firewall
- User: pf_firewall_read
- Password: READ_PASSWORD
- HTTP Method: Get
Adding JSON to Grafana for display
- Upload JSON file to Grafana to take in data
{% file src="/img/pfSense-Grafana-Dashboard.json" %} pfSense Grafana Dashboard {% endfile %}
- Restart the Telegraf service on pfSense
Physical Setup
-9a3add126a32974dd7738cc0e05a2f93.jpg)
Setup Diagram
